COWS
Kelly US Cash Flow Dividend Leaders Index
Why Exposure to this Index
Smarter, not harder, free cash flow investing. The COWSETF Index eliminates hindsight bias by incorporating future free cash flow in security selection, uses risk management by limiting industry exposure, and only selects the leaders from the universe by not being forced to hold 100 names.
Investor ResearchINDEX DETAILS
|
Index Name
Kelly US Cash Flow Dividend Leaders Index
|
|
Ticker
COWSETF
|
|
Forward FCF Yield
12.27%
|
|
Trailing FCF Yield
8.92%
|
|
Trailing 12 Month Dividend Yield
2.13%
|
|
Number of Constituents
61
|
|
Rebalance
Quarterly
|
|
Market Cap
Mid and Large
|
|
Index Calculator
Syntax LLC
|
|
Date
12/15/2023
|
Documents
|
How to Invest in Free Cash Flow Yield
Download
 |
|
Syntax Q1 2024 COWSETF Index Insights
Download
|
|
Importance of Forward Free Cash Flow Report
Download
|
|
Index Rulebook
Download
|
Index Overview
The Kelly US Cash Flow Dividend Leaders Index (the “Index”) targets publicly traded US companies exhibiting characteristics of high free cash flow and consistent dividend growth. The Index utilizes a Forward FCF Yield and Trailing FCF Yield ranking system.
- The Index factors in Forward FCF Yield (defined as estimated forward-year free cash flow per share divided by share price) as part of its screening process to eliminate hindsight bias that plagues other FCF indexes that only use trailing FCF Yield.
- The value of a company is the present value of its FUTURE free cash flow. By only looking retrospectively at trailing FCF Yield, investors could end up owning negative FCF companies, or transient-FCF Yield companies that end up being “value traps,” because their businesses have been structurally altered.
- Risk & Sector Controls: The COWSETF Index may minimize idiosyncratic risks by implementing an industry cap of 24%. Getting in and out of the right sectors at the right times is difficult for several reasons, including the nature of rebalancing and the lag effect. There should be a focus on risk exposure and diversification, especially to avoid idiosyncratic sector risks. A competing Cash “COWZ” index does not restrict sector exposure which can be mitigated by using an allocation process that constraints industry exposure.
- Free cash flow is the cash remaining after a company has paid expenses, interest, taxes, and long-term investments. It can be used to buy back stock, pay dividends, or participate in mergers and acquisitions. The ability to generate a high free cash flow yield indicates a company is producing more cash than it needs to run the business and can invest in growth opportunities.
- Free Cash Flow (FCF) Yield measures the amount of cash generated from the core operations of a company relative to its valuation.
- First Value Date: 21 September 2007.
- Quarterly Reconstitution: March, June, September and December (the “Reconstitution Months”).
Index Linked Products
| Product Name | Ticker |
|---|---|
| Amplify Cash Flow Dividend Leaders ETF | COWS |
| Amplify Cash Flow High Income ETF | HCOW |
Performance
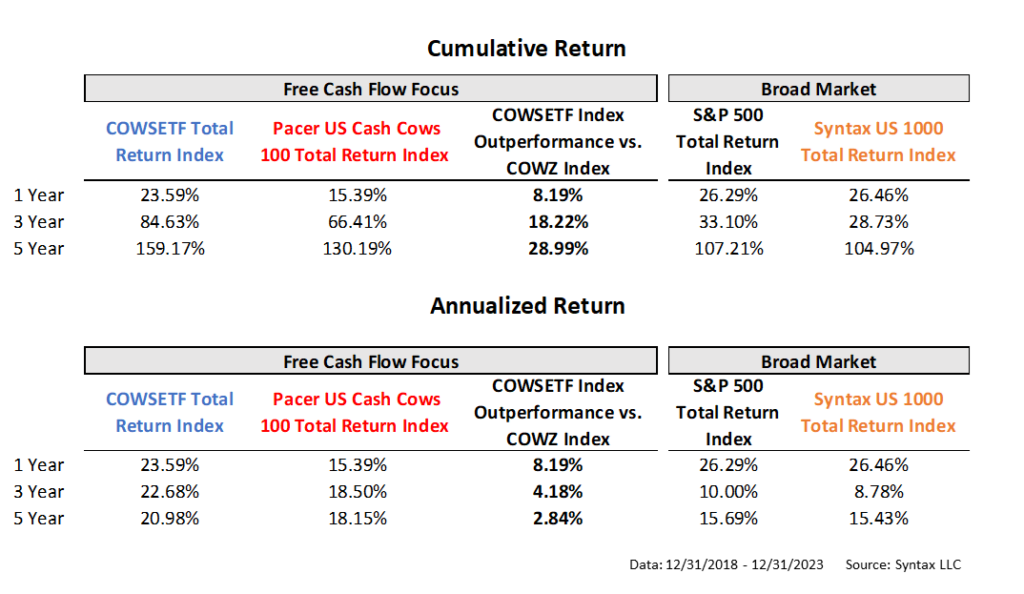
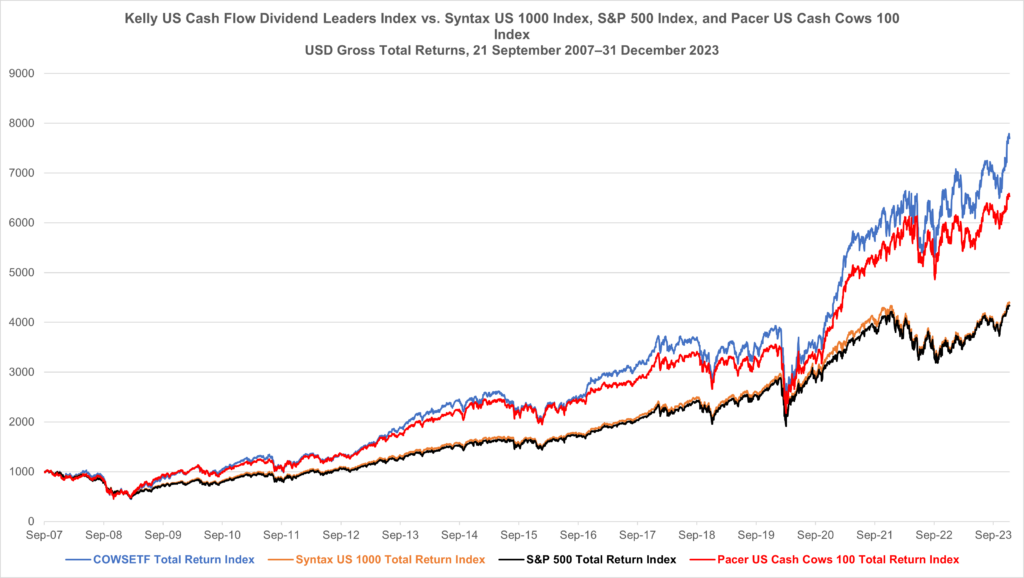
Past performance is no guarantee of future results. Some of the performance presented herein is backtested performance. Backtested performance is not actual performance, but is hypothetical. The backtest calculations are based on the same methodology that is intended to be used when the index is officially launched. However, back-tested data may reflect the application of the index methodology with the benefit of hindsight, and the historic calculations of an index may change from month to month based on revisions to the underlying economic data used in the calculation of the index. The index methodology and backtested performance is subject to change prior to inception. Charts, graphs, and graphics are provided for illustrative purposes only.
Diversification Tool – Active Share
Offers a tool for diversification due to little overlap with traditional indices. COWSETF Index can be a complement to traditional core equity strategies.
Active Share:
Active share is the percentage of a portfolio’s stock holdings that differ from its benchmark index.
| Index Name | Ticker | Active Share (%) | Benchmark for Active Share |
|---|---|---|---|
| Kelly US Cash Flow Dividend Leaders | COWSETF | 97.2 | S&P 500 Index |
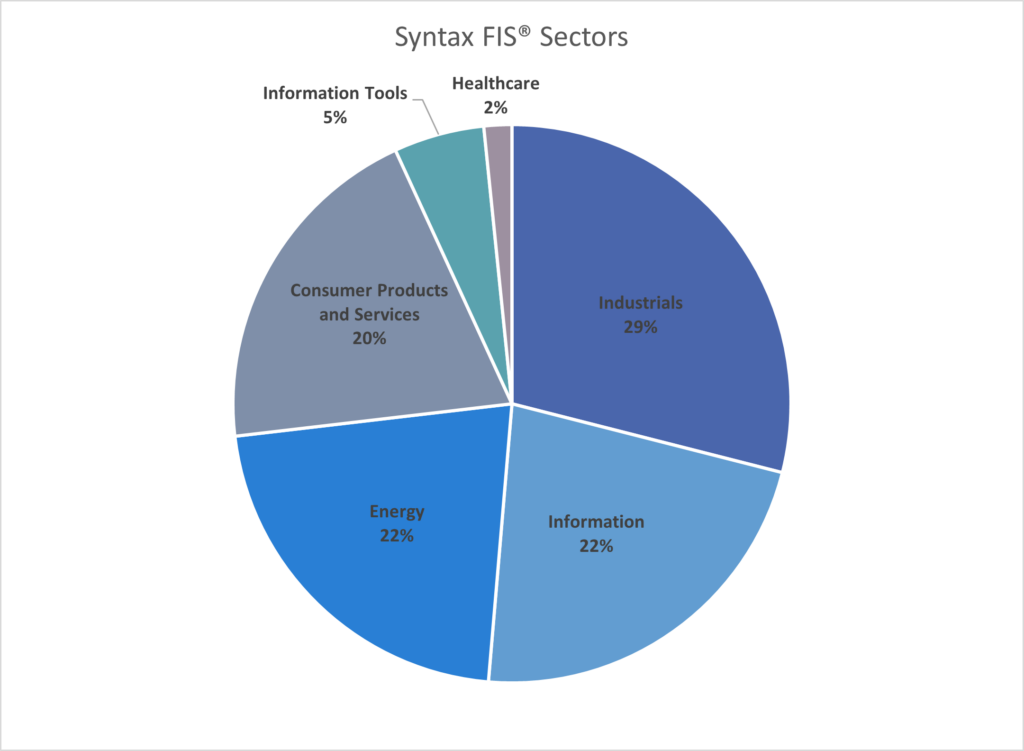
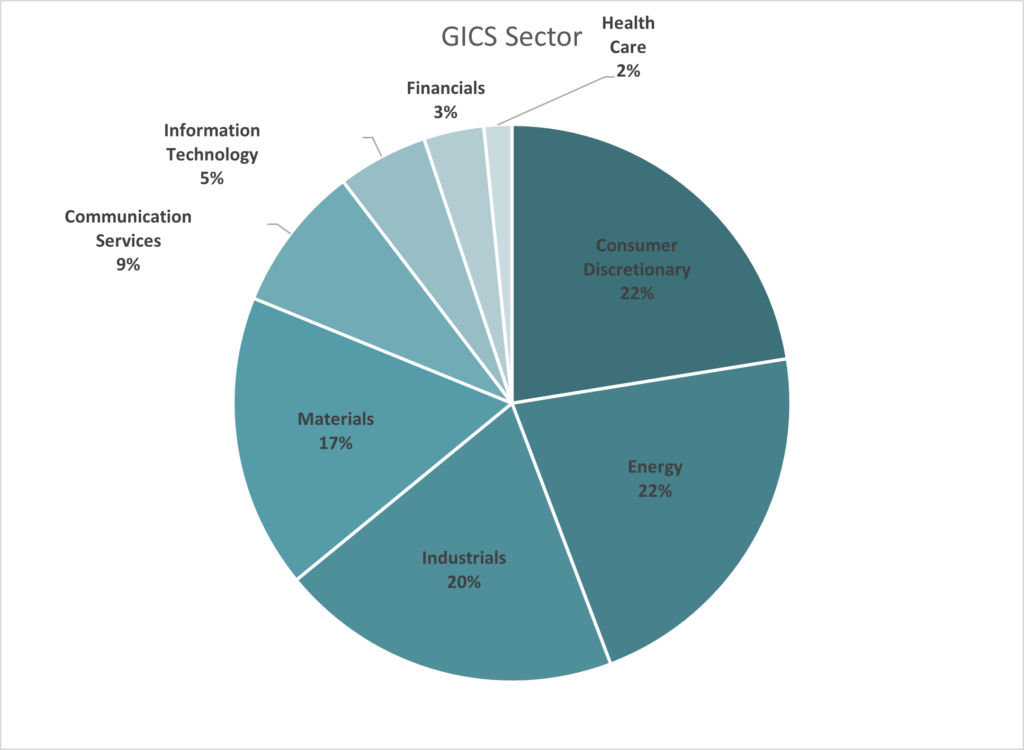
Differentiated Sector Allocation: The index is invested in 61 companies spread across 15 sub-sectors that can be found in six primary sectors. The asset allocation of the index will migrate over time to sectors and companies as they become more attractive.
Sector Exposure
- The Index uses company classification data structured in Syntax’s proprietary Functional Information System (FIS), which draws primarily from audited annual reports (e.g., 10-K filings) and secondarily from unaudited documents (e.g., news articles, company websites) to allow granular groupings and comparisons of companies by the characteristics of their various product lines.
- The Index’s Universe is drawn from the Syntax US 1000 Index (SY1000). Candidates are identified using Syntax FIS data classifying their issuing entities as outside the Financials Sector.
Data as of: December 31st, 2023
[NAME] SITE
Thank you for visiting Kelly Intelligence
You are now being redirected to our [NAME] site.